

Accessing Trade Studies
Open the Trade Studies page from the left sidebar. The page lists all trade studies in your model, and you can create, duplicate, or delete studies from here.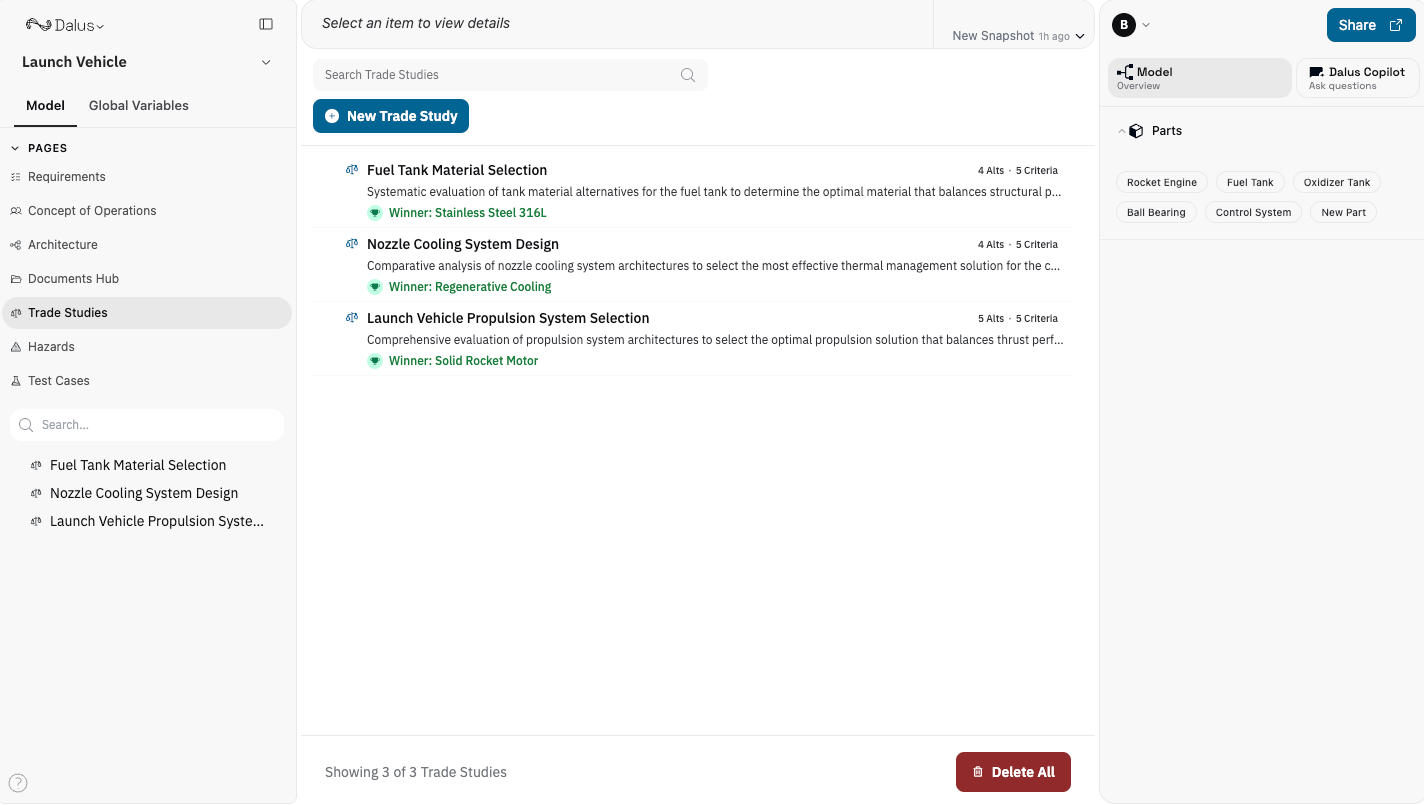
Creating a Trade Study
- Click New Trade Study to create a new study.
- Enter a descriptive title (e.g., “Propulsion System Selection”).
- Optionally add a description to document the decision context and constraints.
Trade Study Components
Each trade study contains three main elements: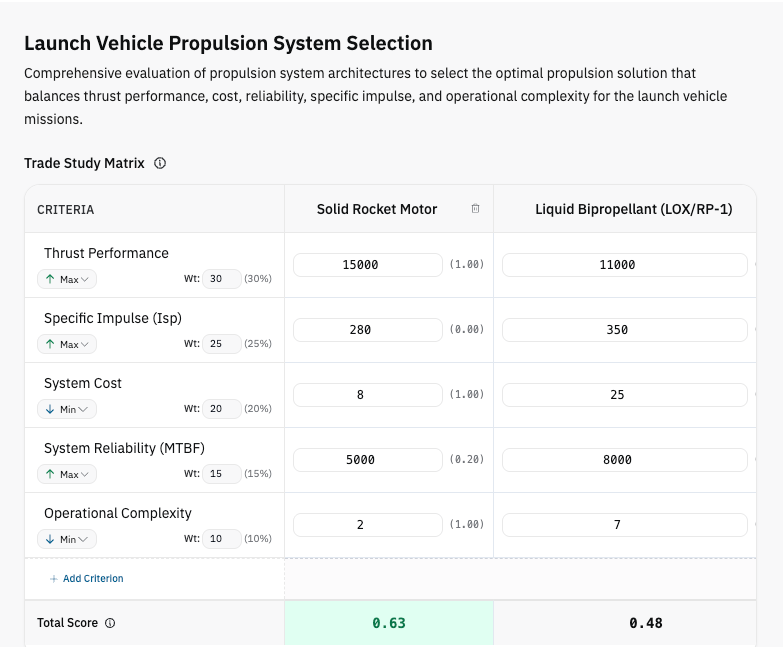
Adding Criteria
Click Add Criterion to define evaluation factors. For each criterion, configure:Name
A clear label describing what you’re measuring (e.g., “Unit Cost”, “System Weight”, “Power Output”).Objective
How the criterion should be optimized: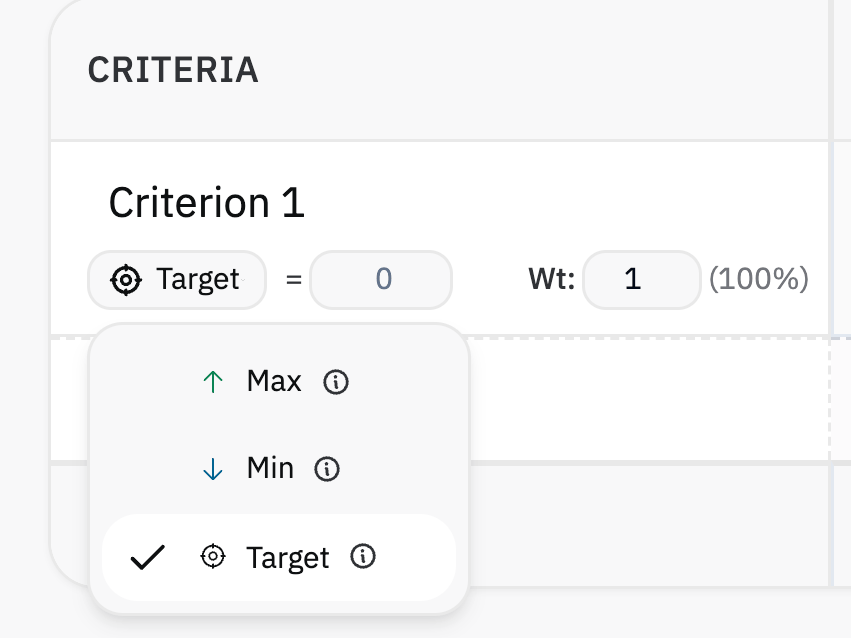
Weight
Relative importance of the criterion. Weights are automatically converted to percentages. Example: If you have three criteria with weights 3, 2, and 1:- Criterion A: 3 / (3+2+1) = 50%
- Criterion B: 2 / (3+2+1) = 33%
- Criterion C: 1 / (3+2+1) = 17%
Adding Alternatives
Click Add in the alternatives header to add design options. Name each alternative clearly (e.g., “Option A: COTS Motor” or “Design 2: Custom Gearbox”).Entering Scores
Enter raw scores in the matrix cells where each row is a criterion and each column is an alternative. Use actual measured or estimated values—not normalized scores. Examples:- Cost: Enter the actual dollar amount ($50,000)
- Weight: Enter kilograms (12.5 kg)
- Efficiency: Enter percentage (87%)
Understanding Normalized Scores
Raw scores are converted to normalized scores (shown in parentheses) so different units can be compared fairly:- 1.0 = Best possible performance for this criterion
- 0.0 = Worst possible performance for this criterion
- For Maximize: The highest raw value gets 1.0
- For Minimize: The lowest raw value gets 1.0
- For Target: The value closest to the target gets the highest score
Total Score Calculation
The total score for each alternative is calculated as: Total = Σ (Normalized Score × Weight %) for each criterion The alternative with the highest total score is highlighted as the winner.Empty or undefined scores are treated as 0. Make sure to fill in all values for accurate comparisons.
Score Distribution Chart
Below the matrix, a pie chart visualizes how alternatives compare. Hover over segments to see exact scores. This helps stakeholders quickly grasp the relative performance of each option.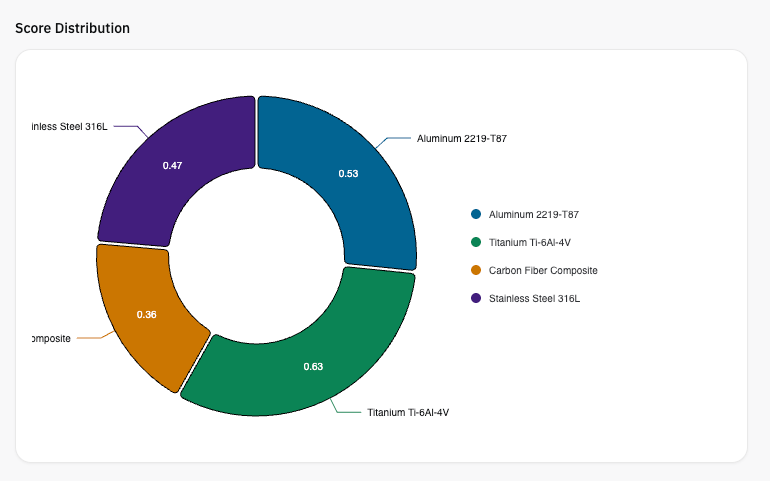
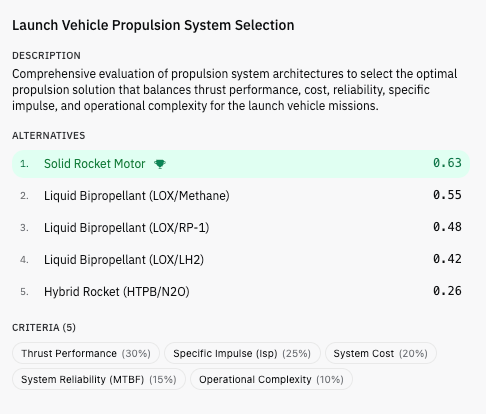
Right Sidebar Summary
When you select a trade study from the left sidebar, a summary panel appears in the right sidebar showing:- Description — The decision context and constraints
- Alternatives — Ranked by total score, with the winner highlighted and marked with a trophy icon
- Criteria — Listed with their weight percentages as tags
Trade Study Workflow
- Define the decision — What are you trying to choose?
- Identify criteria — What factors matter for this decision?
- Set objectives — Should each criterion be maximized, minimized, or hit a target?
- Assign weights — How important is each criterion relative to others?
- Add alternatives — What options are you comparing?
- Enter raw scores — What are the actual values for each alternative?
- Review results — Which alternative has the highest total score?
- Document rationale — Use the description field to explain your decision.
Best Practices
- Use measurable criteria — Avoid vague factors like “quality.” Instead, use specific metrics like “mean time between failures” or “defect rate.”
- Validate weights with stakeholders — Criteria weighting often reveals differing priorities. Discuss weights before entering scores.
- Include sensitivity analysis — Try adjusting weights to see if the winner changes. A robust decision should hold up under reasonable weight variations.
- Document assumptions — Use the description field to note where scores came from and what assumptions were made.
- Keep alternatives comparable — All options should be viable solutions to the same problem. Don’t compare apples to oranges.
Keyboard Shortcuts
Permissions
Trade study management respects model permissions:
Viewers can browse trade studies but cannot modify them.